Xdebug with vagrant
設定使用 vagrant php 執行 xdebug
在設定 Preferences / Languages & Framework / PHP 中
指定 vagrant 的位置與執行的 php 位置

確認 php 有支援 xdebug
若設定正確,可以在 General 區塊中看到 Debugger: Xdebug 2.4.0
Homestead 的 Vagrant 預設皆有安裝 Xdebug

設定 vagrant 中的 xdebug 套件
使用 vagrant ssh 進入虛擬機後,編輯 /etc/php/7.0/cli/conf.d/20-xdebug.ini 檔案,使用下列設定
zend_extension=xdebug.so
xdebug.remote_enable=1
xdebug.remote_connect_back = 1
xdebug.remote_port = 9000
設定 debug 環境
執行 phpstorm debug

debug 參數設定
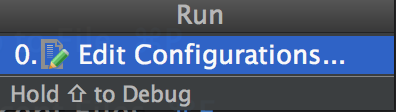
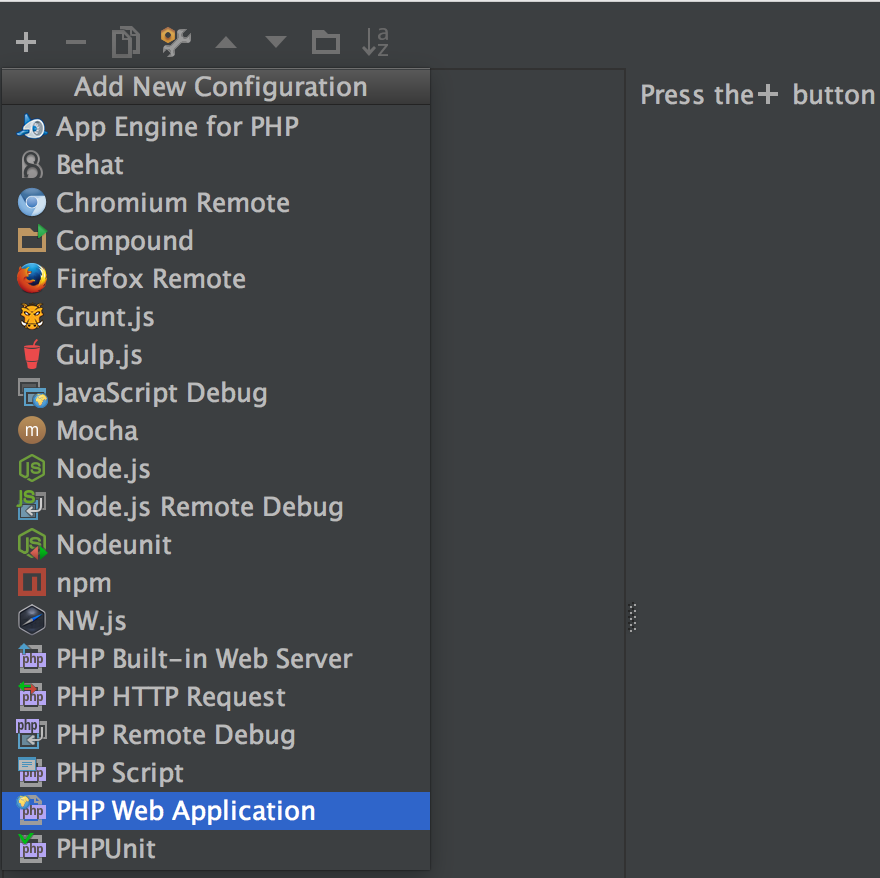
新增 PHP Web Application
新增伺服器
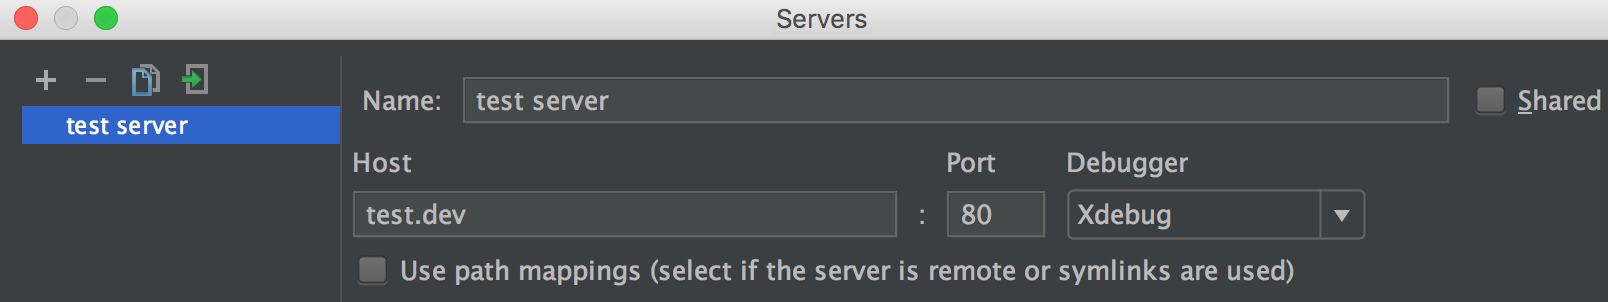
伺服器新增完成

開始 debug
設定程式中斷點

重新執行 debug
debug test.dev

執行測試後將會看到後面帶有 XDEBUG_SESSION_START 的參數在後面,這樣 xdebug 才能抓到需要 debug 的頁面,網址會像是
http://test.dev/test.php?XDEBUG_SESSION_START=11023
到 chrome 開啟此網址後,會看到頁面被中斷掉
重新回到 phpstorm 看 xdebug 測試結果
